A visual language with a data contract
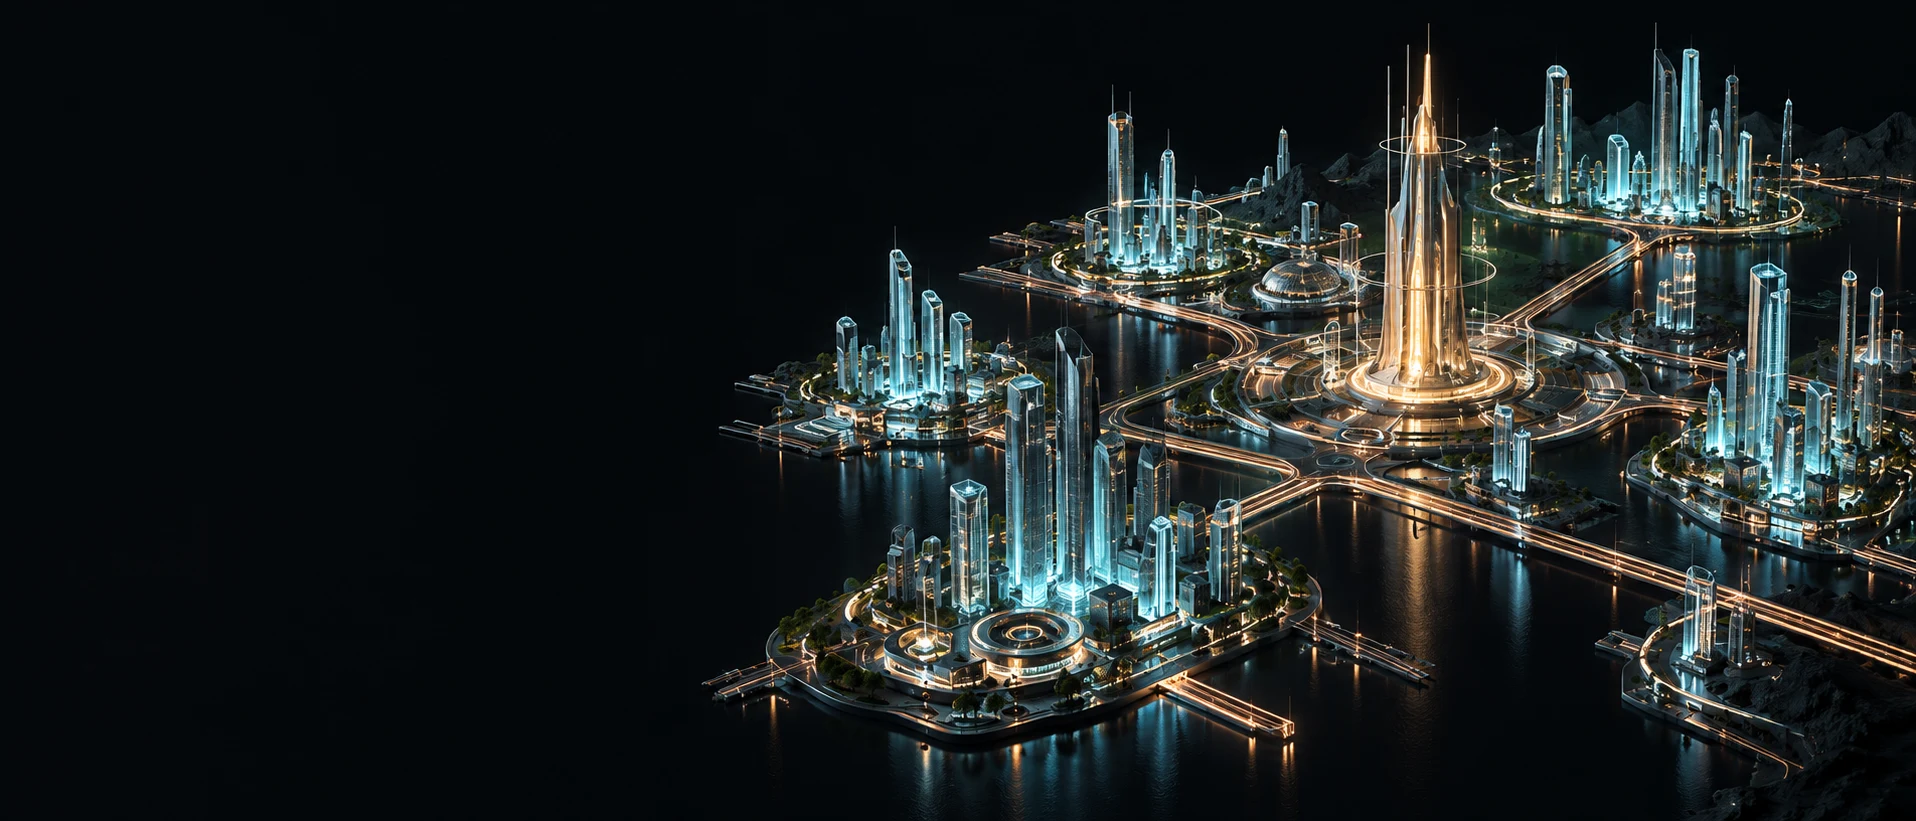
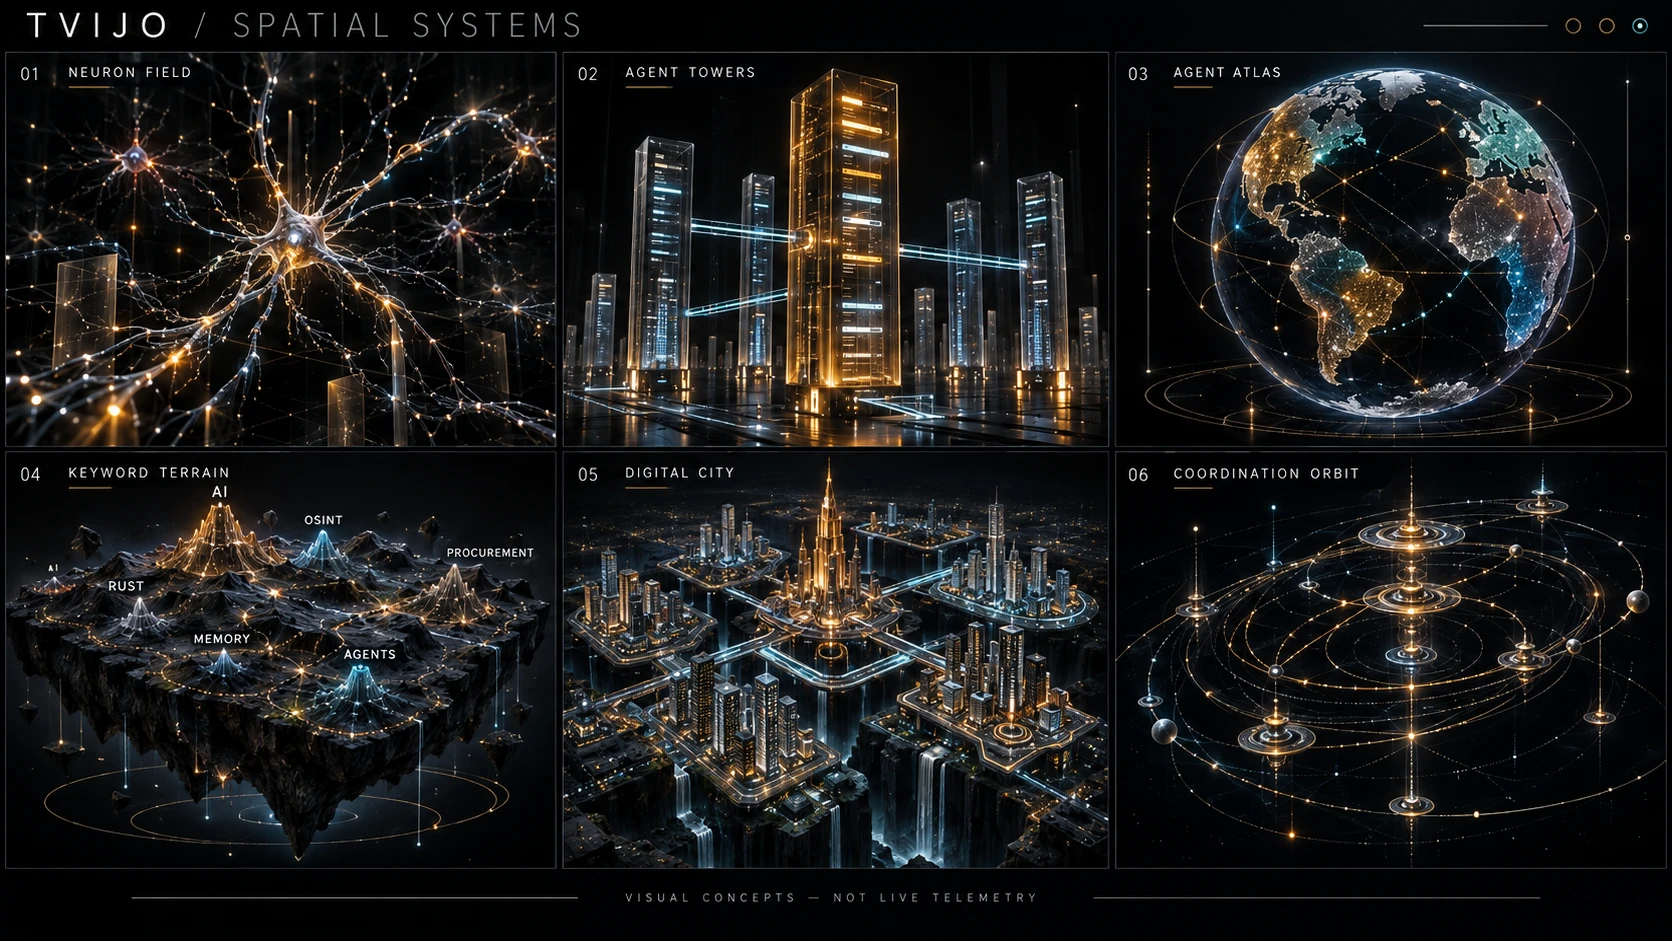
Neurons show knowledge relationships. Towers show task containers. A geographic atlas shows source coverage. Keyword terrain groups themes. A city maps services and projects. Orbits show process stages. Each visual needs a named mapping from data to geometry; height, brightness and movement must not silently imply intelligence, truth or performance.
Real countries and agent territories
Keep geographical country boundaries separate from fictional team territories. A map can answer where a procurement source operates or which language it covers. An abstract territory can group a team’s tasks. They are different layers with different sources. The concept globe is artwork, not an authoritative geographic dataset.
Interaction should reveal evidence
A production node should open its purpose, source, status and observation time. Filters should preserve the selected object and offer an accessible list. An animation pause and reduced-motion mode make a complex surface easier to use. These pages introduce the visual language through a six-scene selector; no live agent telemetry is implied.
Sources and boundaries
Adapted from the project operator wiki and recorded engineering evidence, observed 15 October 2026. Practical recommendations are distinguished from scoped implementation results.
Read the related evidence wiki →